California School Dashboard Data Unveiled: A Detailed Look at Education Trends
On November 21, 2024, the California Department of Education made waves by releasing the latest data on school and district performance through the official California School Dashboard. This update provides a comprehensive overview of achievements, progress, and areas that need improvement across various measures. From chronic absenteeism rates to high school graduation rates, this data paints a vivid picture of the state of education in California.
**Insights Galore: What the Data Reveals**
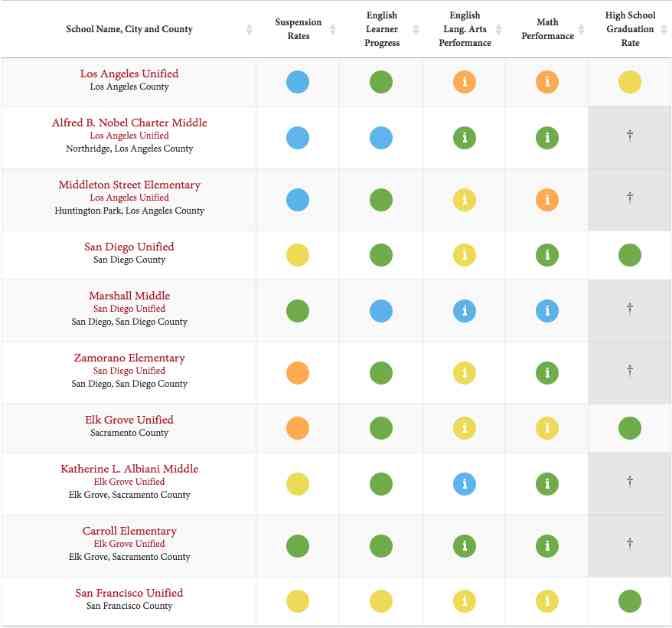
The California School Dashboard is a treasure trove of information, showcasing a wide array of metrics in a color-coded format that simplifies complex data. From chronic absenteeism rates to English Language Arts and Math performance, the dashboard offers a comprehensive view of how schools and districts are faring. Each color on the spectrum signifies a different performance level, ranging from red (lowest) to blue (highest).
**Understanding the Metrics: A Closer Look**
– **Chronic Absenteeism Rate**: This metric reveals the proportion of students who miss 10 percent or more expected days of attendance in a school year. It is a crucial indicator of student engagement and overall well-being.
– **Suspension Rates**: Reflecting current suspension rates and changes over time, this metric sheds light on disciplinary practices within schools.
– **English Language Arts and Math Performance**: These measures assess student performance in Grades 3-8 and 11 on standardized tests, highlighting strengths and weaknesses in key subjects.
– **High School Graduation Rate**: A pivotal metric that combines four-year and five-year graduation rates, offering insights into overall student success and persistence.
**Unveiling Trends: What Lies Beneath the Numbers**
As we delve into the depths of the California School Dashboard data, we uncover trends that go beyond mere statistics. The impact of the pandemic on education is evident in missing or incomplete years of data, underscoring the disruptions faced by schools and districts. However, amidst the challenges, there are also stories of resilience, innovation, and dedication that shine through the numbers.
**Charting a Path Forward: Leveraging Data for Change**
In a rapidly evolving educational landscape, data-driven insights are more crucial than ever. By harnessing the power of the California School Dashboard data, educators, policymakers, and stakeholders can identify areas for improvement, celebrate successes, and work towards a brighter future for all students. As we navigate the complexities of education in the 21st century, let us remember that behind every data point lies a story waiting to be told.
Let’s explore the California School Dashboard data together and unlock the potential for positive change in our schools and communities. The journey begins with a single click—dive into the data, uncover the trends, and join the conversation on shaping the future of education in California. Together, we can make a difference, one data point at a time.
