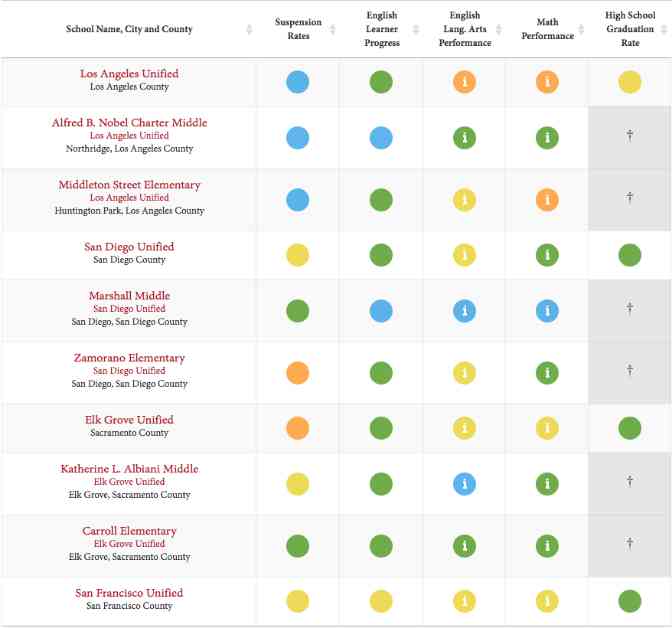
On November 21, 2024, the California Department of Education released the most recent data for schools and districts on the California School Dashboard. This data allows you to compare school performance over the years 2023, 2019, 2018, and 2017. The dashboard uses color codes to indicate achievement and progress in various areas, providing a visual representation of performance metrics set by the state.
You can easily search for specific schools, cities, districts, or counties by entering a search term in the designated box. If a school or district does not appear in the search results, it means that there is no available data for that particular entity. For more detailed test scores, you can click on cells marked with an “i” to access additional information. Additional explanations and notes on the data can be found below the chart.
It is important to note that some years of data may be missing or incomplete due to the disruptions caused by the pandemic. This has impacted the ability to provide a comprehensive overview of school performance in certain years.
The dashboard utilizes color-coded performance levels to indicate school performance, ranging from red (lowest performance) to blue (highest performance). These color codes are based on a combination of current performance levels and changes compared to the previous year. More information on how these performance levels are calculated can be found on the California Department of Education’s website.
Key indicators included in the dashboard are:
– Chronic Absenteeism Rate: The proportion of students who miss 10 percent or more of expected days of attendance in a school year. This indicator is not reported for high schools.
– Suspension Rates: Based on current suspension rates and changes in those rates over time.
– English Language Arts Performance: Student performance in English Language Arts tests for Grades 3-8 and 11, including improvements, declines, or stability compared to the previous year.
– Math Performance: Student performance in math tests for Grades 3-8 and 11, with comparisons to the previous year.
– High School Graduation Rate: Combined four-year and five-year graduation rates, including current rates and changes over the previous year.
To access the full dashboard for each school or district, you can visit the provided link. This comprehensive data allows stakeholders to track and analyze school performance over multiple years, providing valuable insights into areas of strength and areas for improvement.
